Element Overview
 Updated 3 months ago
by
Stephanie Krenz
Updated 3 months ago
by
Stephanie Krenz
The element overview in the middle of the Package Editor shows you how various elements are connected and linked. Depending on which element you select in the left-hand area, the overview in the middle is changed or expanded. If you click on the BKPF table as shown in the screenshot above, it will be displayed in the element overview. As there is no link to filters or similar here, the table is displayed alone in the overview for the time being.
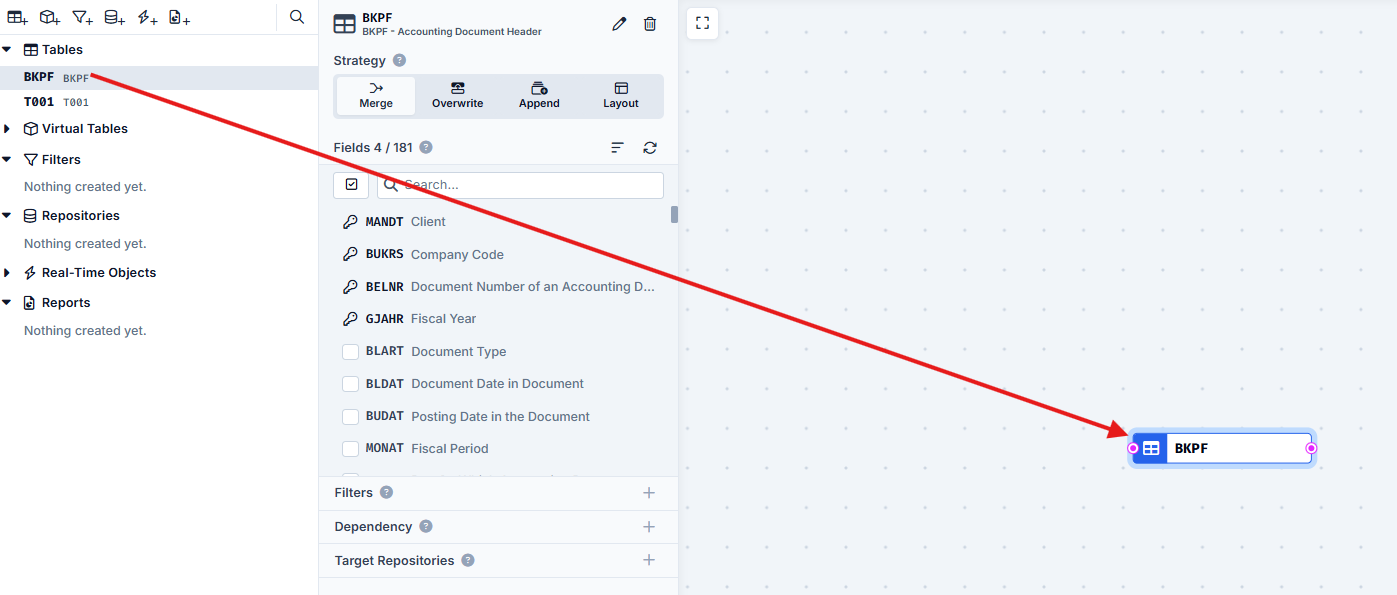
There is a button at the top left and at the top right with which you can hide or show the area on the left or right. You can see the SAP system you have selected at the bottom left and you can zoom in or out of the overview at the bottom right.
If you click and hold the left mouse button in the gray area next to the elements, you can move the area by moving the mouse.
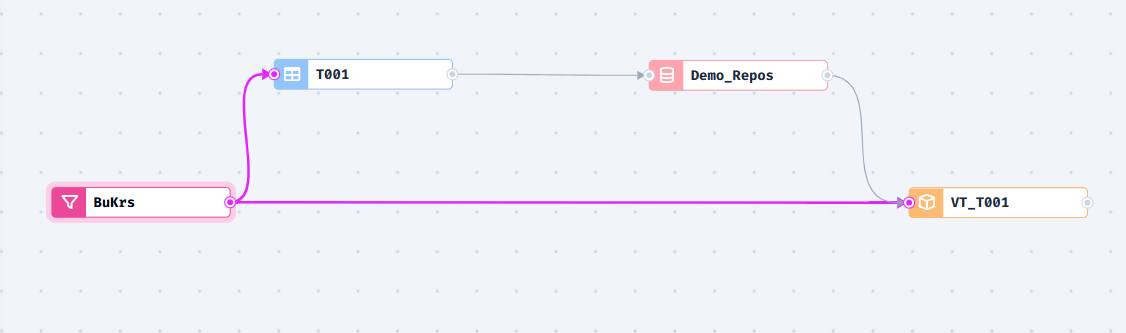
The overview contains various elements, such as the nodes (boxes) and connections (arrows). Each node color represents a different element. The symbols on the left of the node also help you to assign the elements:
- Dark Blue: represents the Tables (here T001)
- Yellow: represents the virtual Tables (here VT_001)
- Purple: represents the Filters (here BuKrs > means CompanyCode)
- Orange: represents the Repositories (here Demo_Repos)
- Green: represents the Real-Time Objects (here CompanyCode)
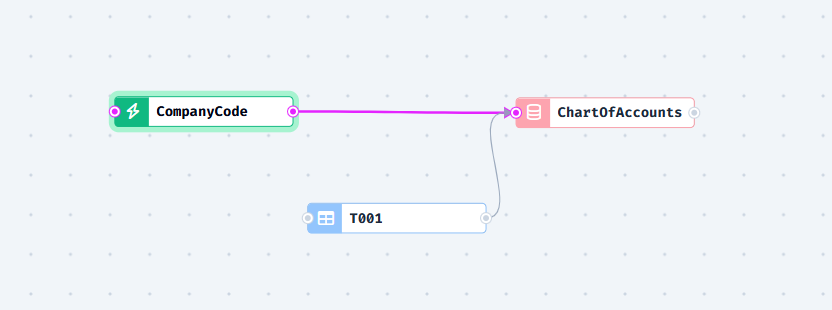
The colours of the elements may vary depending on the version.
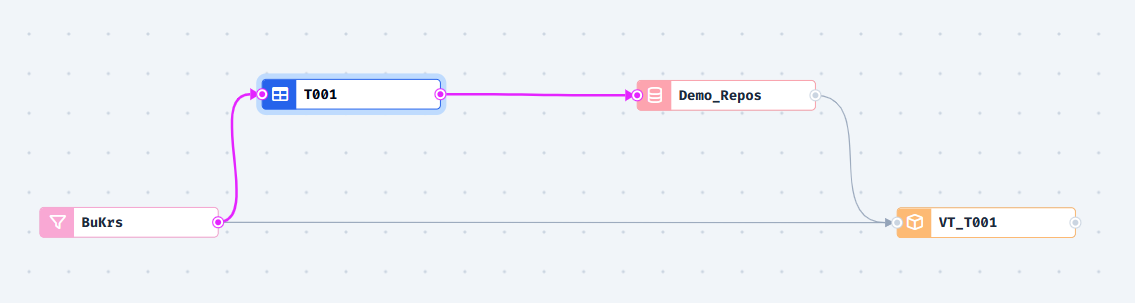
Depending on which node you select or click on, the arrows light up blue and thus show the connections to and from the selected node.
In the next screenshot, for example, the BuKrs filter has been marked. The arrows show that this filter is used in table T001 and in the virtual table VT_001.
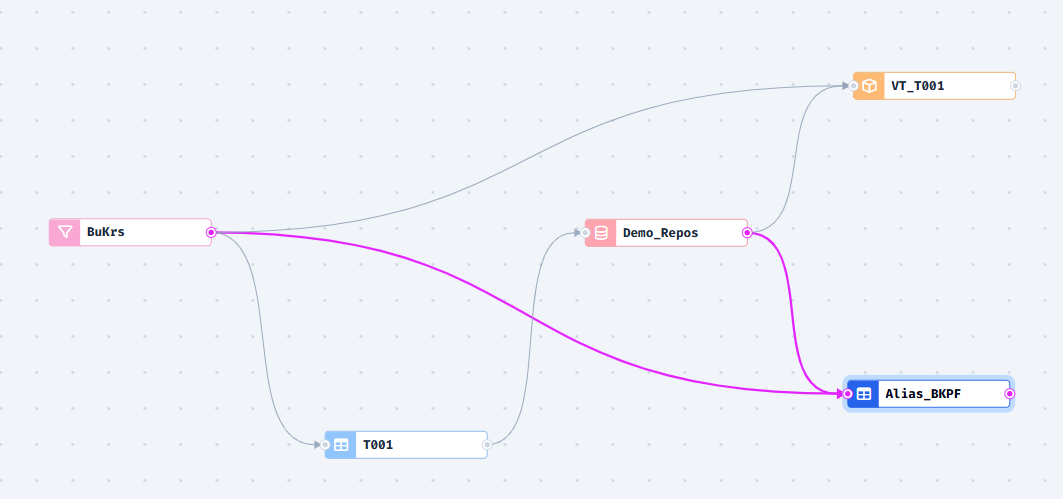
If we now also add the filter and the repository to a second table, e.g. BKPF, you will see that the element overview quickly becomes more complex. By clicking on the new table BKPF (here with assigned table alias: Alias_BKPF), you can now also see the connection to the filter and the repository.